Important Notes:
The case for liquid real assets in a shifting inflation regime
For over a decade, global investors operated under the assumption that inflation would remain subdued, anchored below 2% - a belief reinforced by central bank credibility and structural disinflationary forces like globalisation and technological deflation. However, the post-pandemic world has ushered in a new regime of structurally higher inflation risks, with evolving policy responses that make liquid real assets increasingly attractive.
Greater China Equities: Perspective for Q4 2025
Heading into the final quarter of the year, we remain constructive, supported by the US Federal Reserve interest rate cutting cycle, Mainland’s demand-side stimulus, strategic priorities outlined in the 15th Five-Year Plan, continued recovery in corporate earnings and robust fund inflows.
Q&A: Potential market impact of a US government shutdown
The US Senate failed to pass a last-minute funding deal, triggering the first federal government shutdown in nearly seven years starting from 1 October. Our Multi-Asset Solutions Team shares insights on how markets have responded during past shutdowns, and how investors can position themselves amid the uncertainty.
9 August 2024
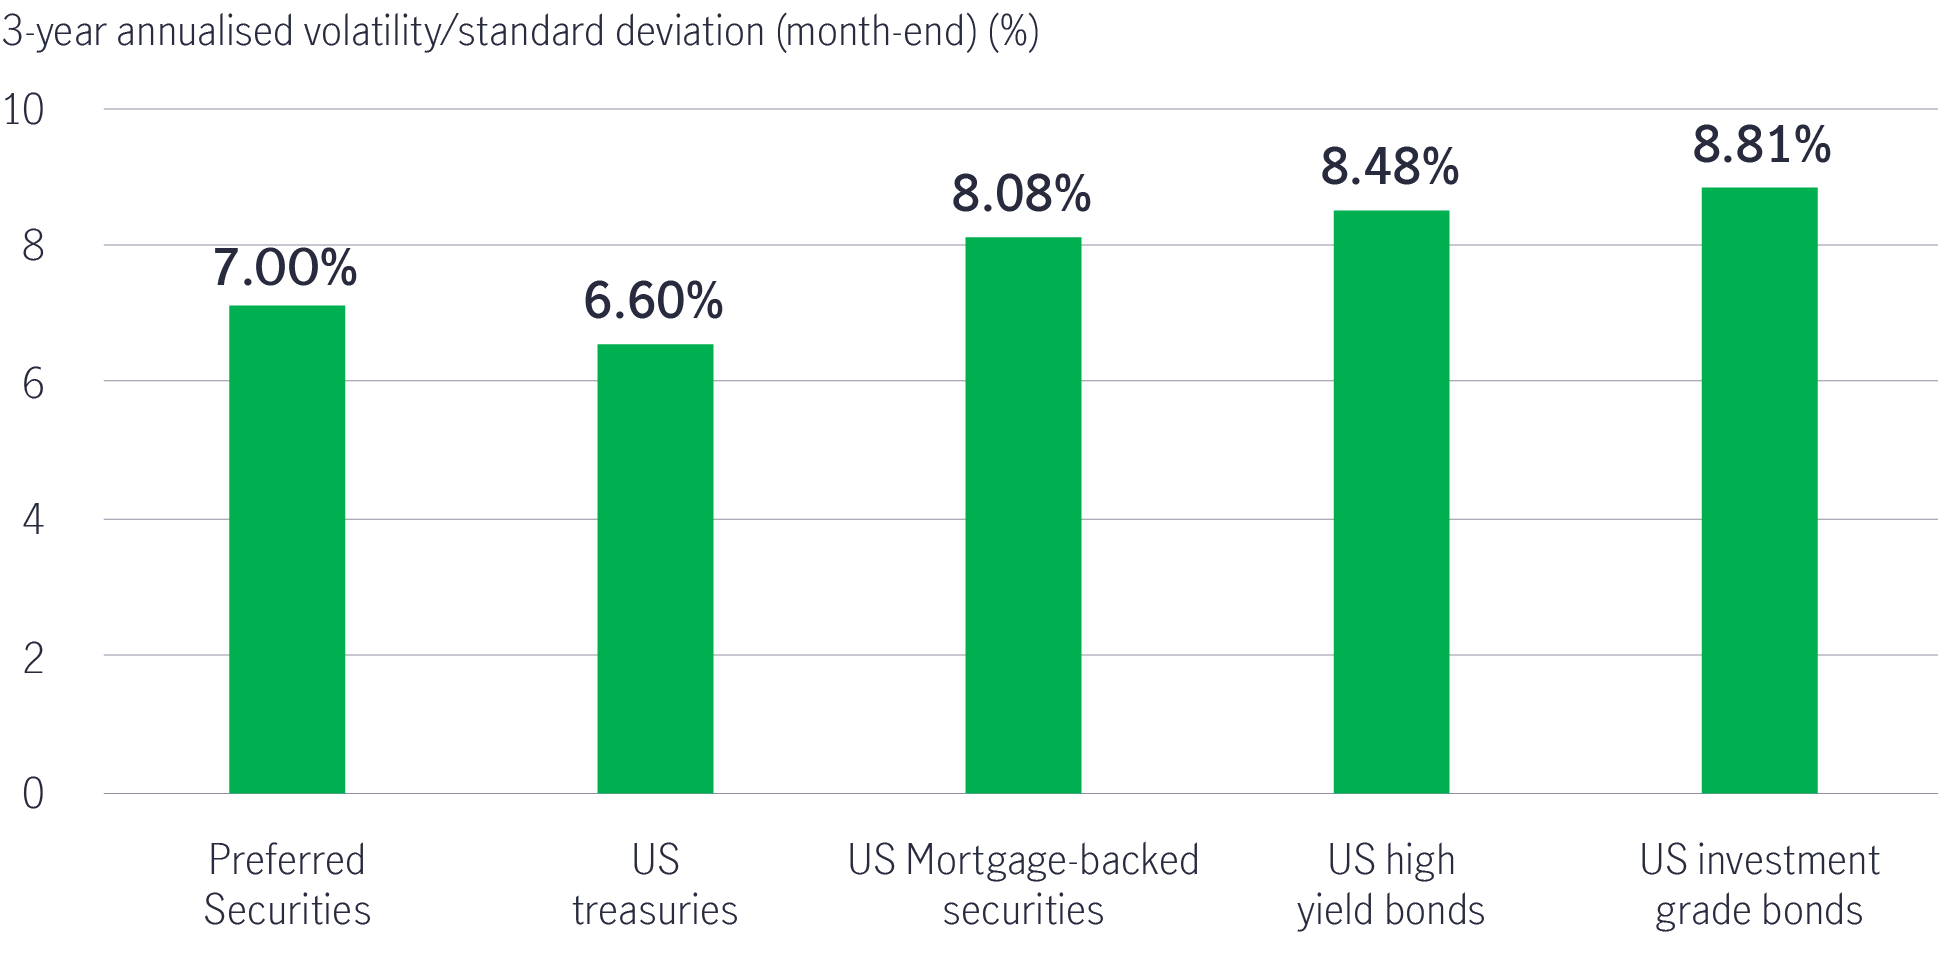
Risks can be measured using quantitative parameters. Over the past year, volatility in broad fixed-income markets was largely driven by interest-rate risk, given the lingering concerns about uncertain rate paths. If we look into a three-year horizon, which fully covers both accommodative (zero federal funds rate) and tightening cycles (federal funds rate reached 23-year highs of 5.25% to 5.5%) amid a still resilient US economy1, preferred securities (institutional par) showed slightly higher volatility (7.00%) than US Treasuries (6.60%), but less volatile than other rate-sensitive assets like US mortgage-backed securities (MBS) (8.08%) and US investment-grade bonds (8.81%) (Chart 1).
Chart 1: Volatility of US fixed income assets2
Due to the 525 basis point US Federal Reserve rate hike during the period, preferred securities demonstrated a relatively better return than US Treasuries, MBS and investment-grade bonds (Chart 2).
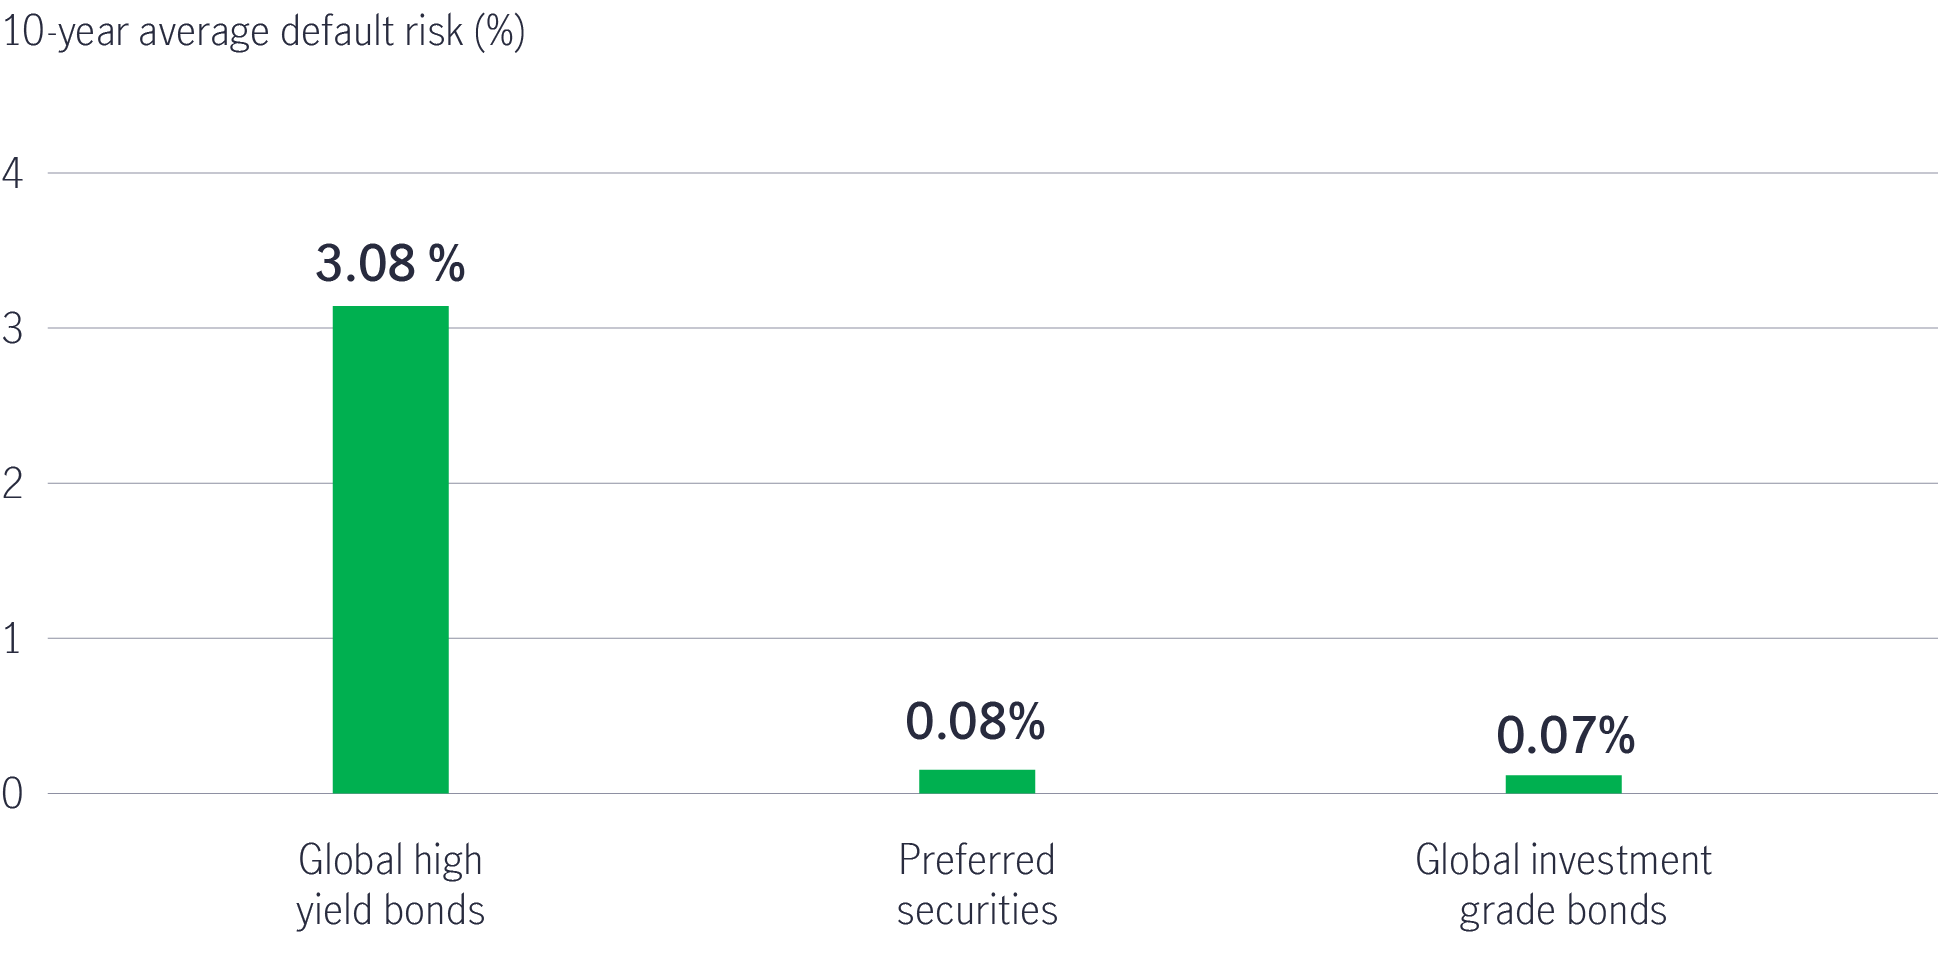
Risks can also be demonstrated from a qualitative perspective. If we refer to the credit rating as an indicator of a credit issuer’s financial health and debt obligations, we could enhance the income portfolio yield potential by choosing higher-quality credits (less default risk) with higher yields (higher income). For example, the 10-year average default risk of investment-grade credit assets like preferred securities (Baa2) is just 0.08%. Meanwhile, speculative-grade US high-yield bonds (B1) are more likely to experience default (3.08%). Also, given that the credit rating of preferred securities is five notches higher than US high-yield bonds, their yield is just 69 basis points lower (Chart 2 and 3).
Compared to other higher A-grade assets, the yield of preferred securities is 178, 213 and 275 basis points higher than US investment-grade bonds (A3), US MBS (Aa1), and US Treasuries (Aa1), respectively (Chart 2).
Chart 2: Return of US fixed income assets3
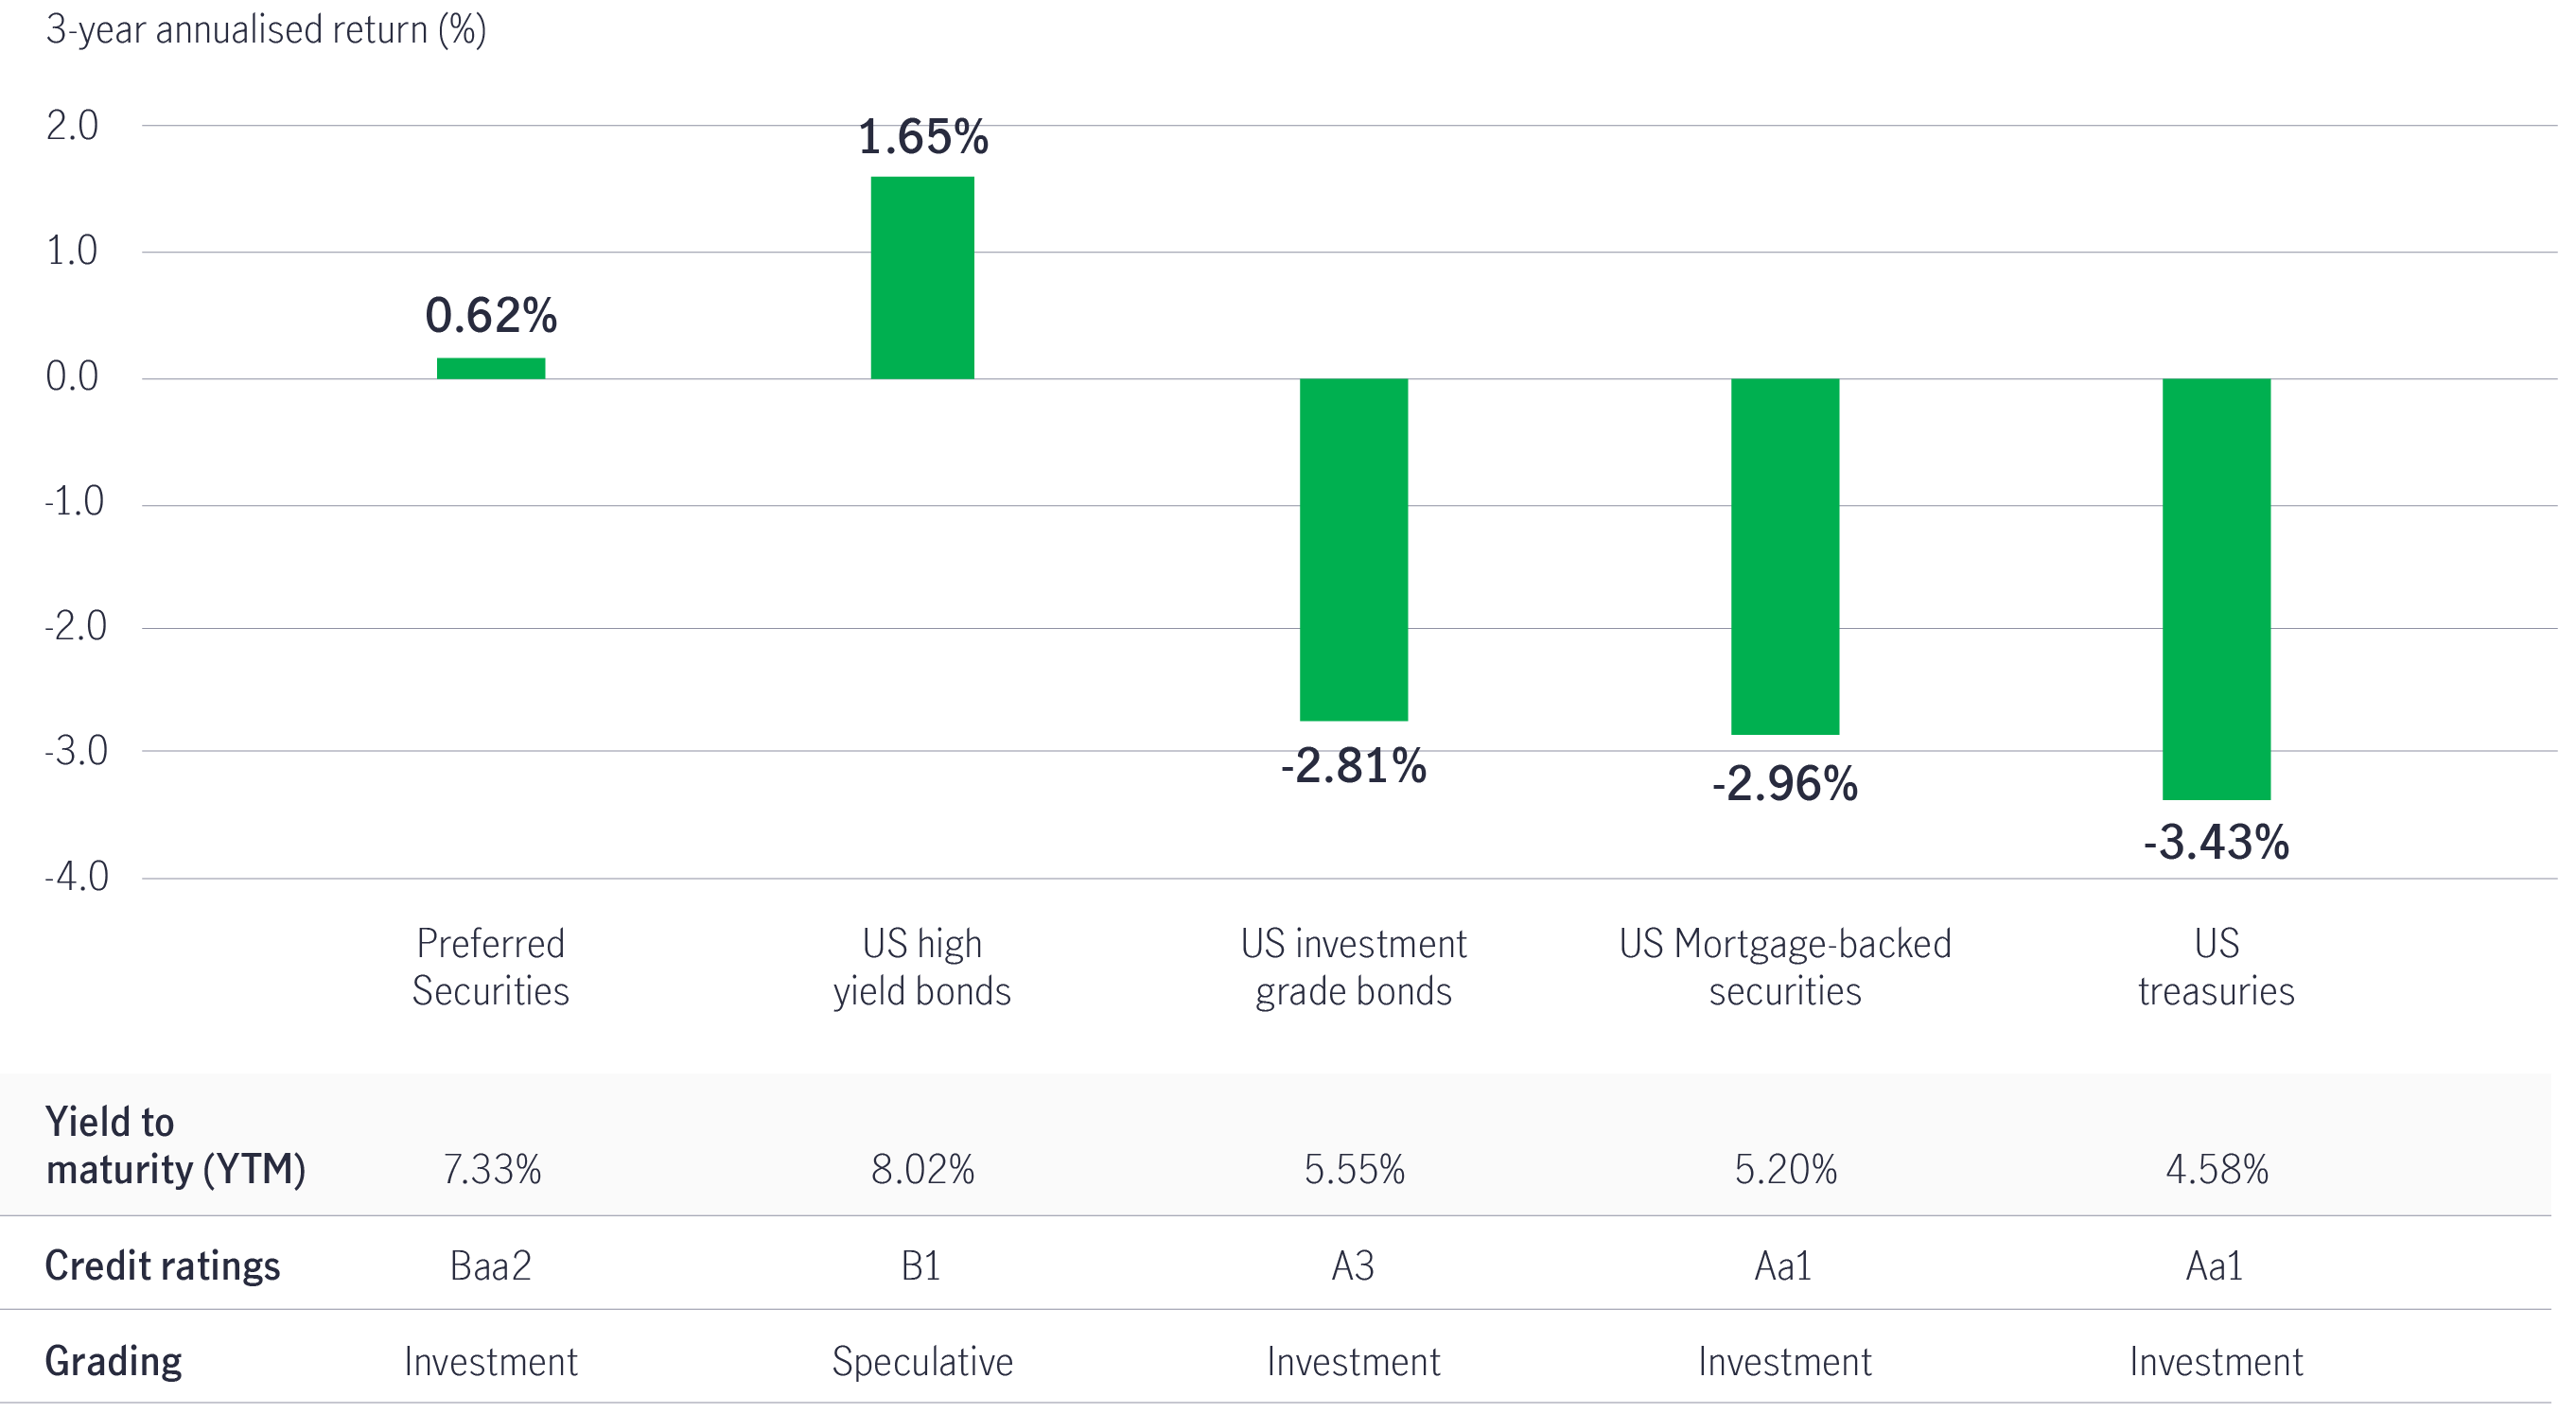
Chart 3: Higher quality with lower default risk4
An unconstrained approach to US fixed-income solutions should benefit from the flexibility to navigate the entire opportunity set of credit and rates and allocate to sectors with relatively attractive risk-return profiles per the macro environment. The aim is to provide a stable, consistent income stream to help investors navigate the changing environment.
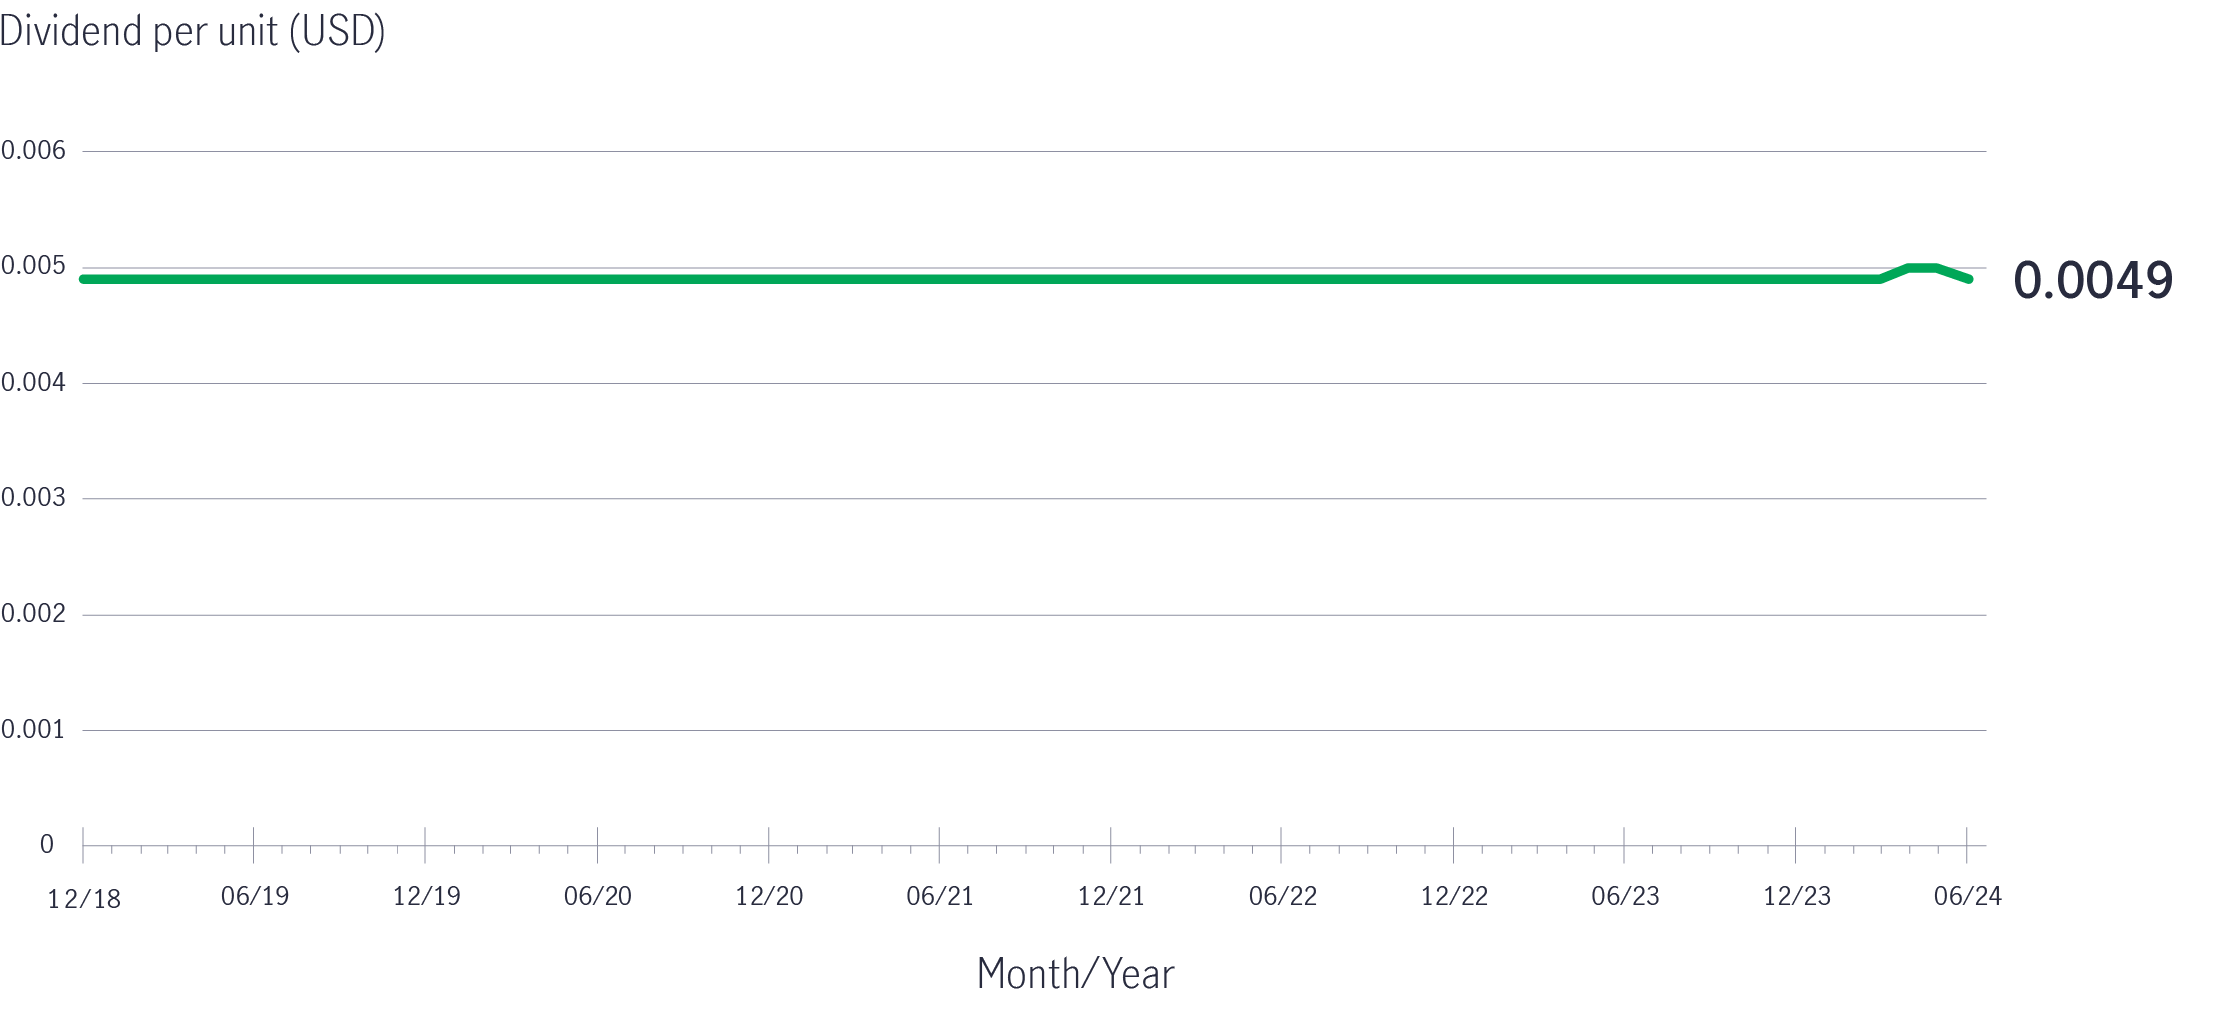
The Fund is designed to offer a relatively stable distribution policy since launch5 . Starting from its first distribution in December 2018 to March 2024, the Fund has distributed the same dividend amount of 0.0049 USD per unit (Chart 4).
Chart 4: Relatively stable of dividend payment of the Fund6
There are two income sources for dividend distribution: income received from invested securities (natural yield) and realised gains and/or out of the Fund’s capital.
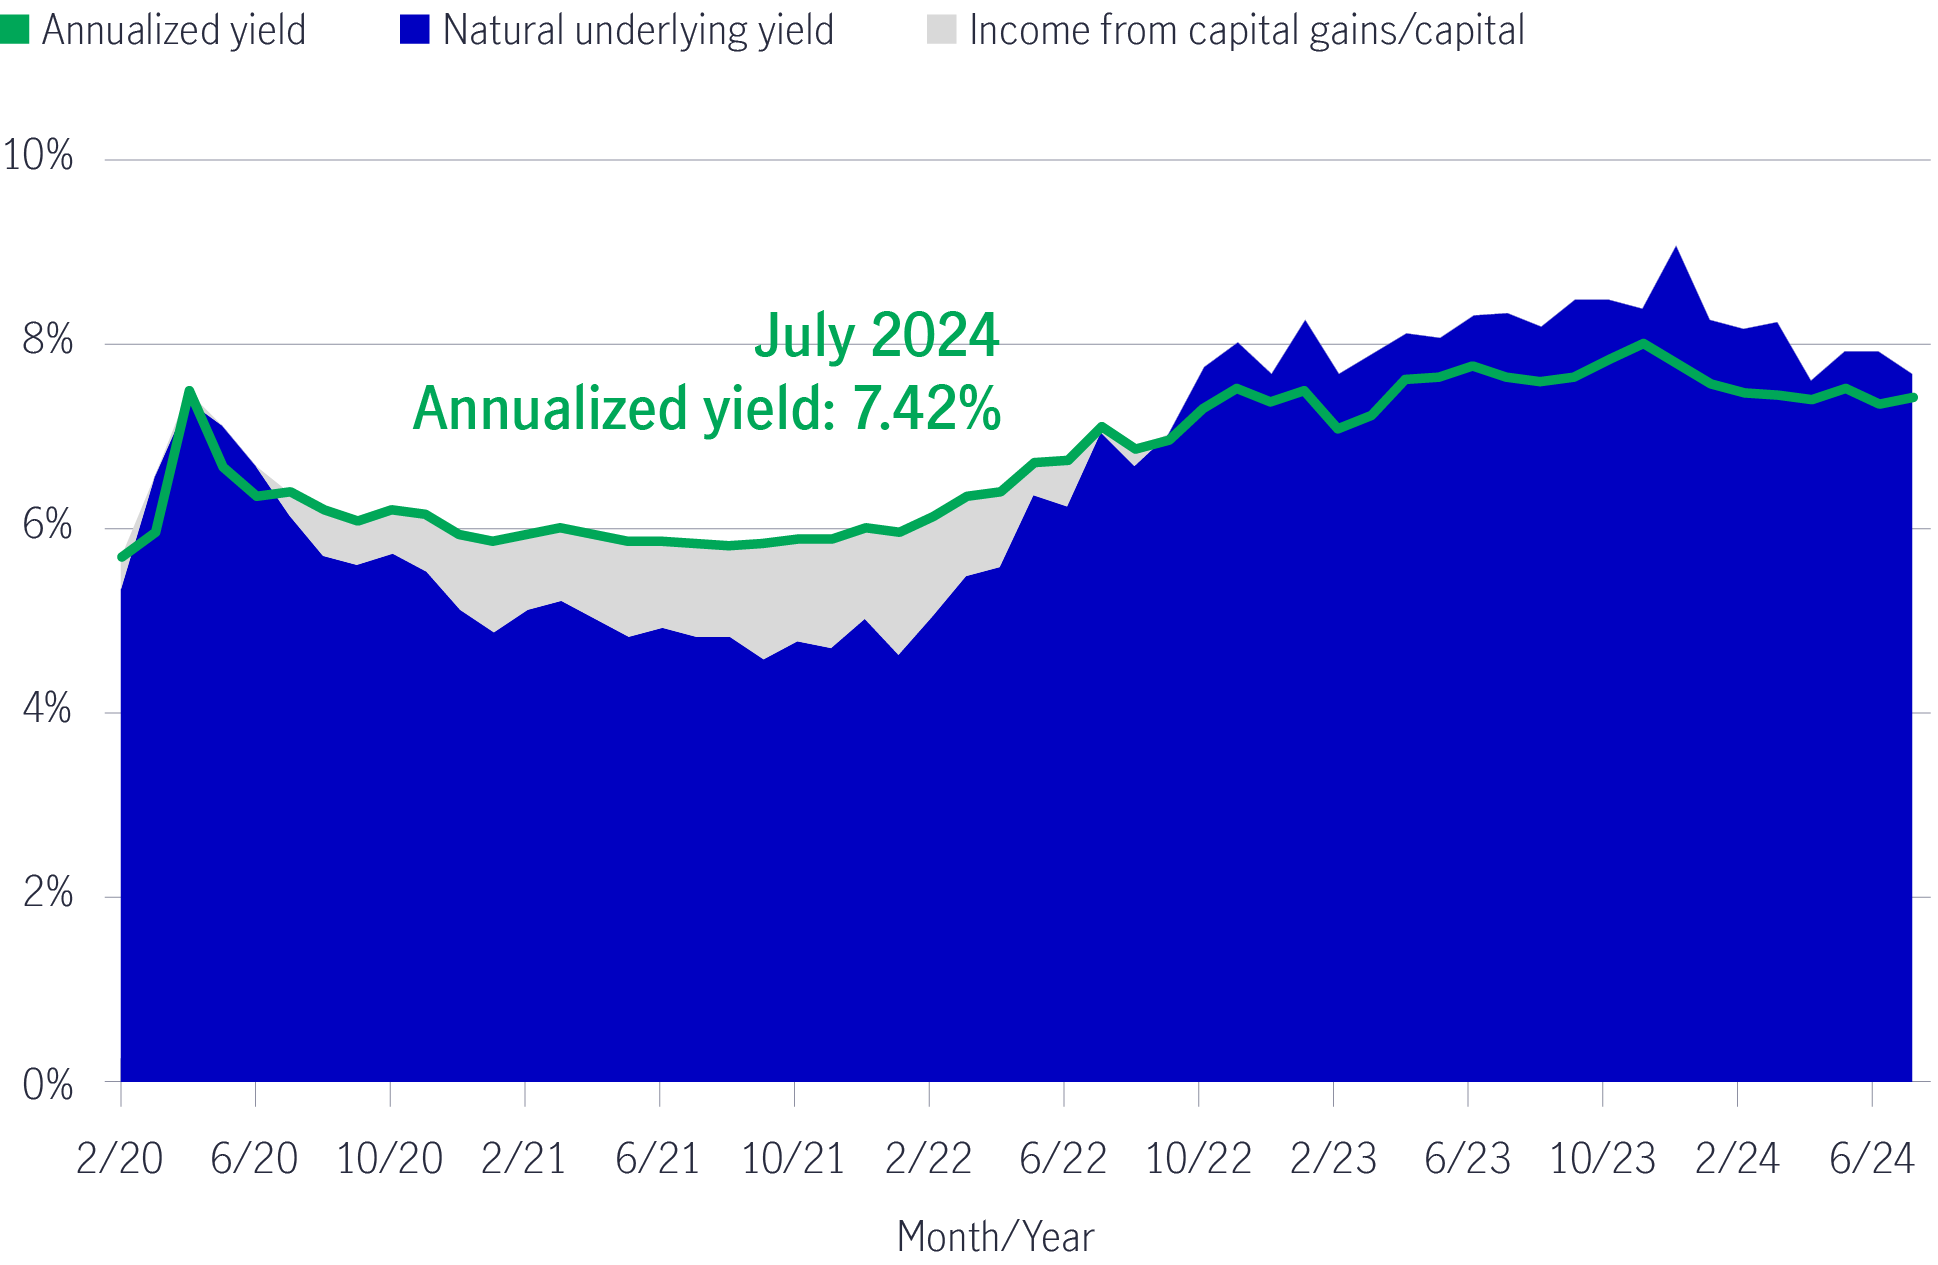
Given the Fund has a significant exposure to North America-related issuers7, portfolio yields vary according to the US Federal Reserve’s (Fed’s) federal funds rate and the US interest-rate environment. During COVID and the Fed’s zero-interest-rate environment (March 2020 – March 2022), the portfolio yield was lower than the annualised dividend yield. However, natural yield remained the primary source of dividend distribution (at least 78% of monthly distribution) (Chart 5).
In March 2022, the portfolio yield improved. This followed the beginning of the Fed’s rate-hiking cycle. From September 2022 onwards, the portfolio yield (blue-shaded area) was even higher than the Fund’s annualised dividend yield (green line).
Chart 5: The Fund’s annualised dividend yield vs natural underlying yield (%)8
Read more:
Better income – Aim for higher, not the highest
Better income – Global multi-asset diversified income
1 Source: Multi-Asset Solutions Team(MAST), as of 30 April 2024.
2 Source: Bloomberg, Morningstar, as of 30 June 2024. Preferred Securities are represented by the ICE BofA US Capital Securities Index, where the average credit quality is BBB; US high yield bonds are represented by the ICE BofA US High Yield Index; US investment grade bonds are represented by the ICE BofA US Corporate Index; US Mortgage-backed securities (MBS) is represented by ICE BofA US Mortgage Backed Securities Index; US Treasuries are represented by ICE BofA US Treasury & Agency Index.
3 Source: Bloomberg, Morningstar, as of 30 June 2024. Preferred Securities are represented by ICE BofA US Capital Securities Index; US high yield bonds are represented by ICE BofA US High Yield Index; US investment grade bonds are represented by ICE BofA US Corporate Index; US mortgage-backed securities (MBS) are represented by ICE BofA US Mortgage Backed Securities Index; US treasuries are represented by ICE BofA US Treasury & Agency Index. The above yield does not represent the distribution yield of the Fund and is not an accurate reflection the actual return that an investor will receive in all cases. A positive distribution yield does not imply a positive return. For illustrative purposes only. Past performance is not indicative of future performance. Credit ratings refers to Moody’s rating scale.
4 Source: Global high yield bonds are represented by ICE BofA Global High Yield Index; Global Investment grade bonds represented by ICE BofA Global Corporate Bond Index; Preferred securities are represented by ICE BofA US All Capital Securities Index. Default rates for global high yield bonds and global IG corporate bonds sourced from Moody’s, as of 30 June 2024. Preferred default rates for preferred securities were calculated by Manulife Investment Management based on ICE BofA US All Capital Securities Index, as of 30 June, 2024. Calculated annually. Past performance is not indicative of future performance. It is not possible to directly invest in index.
5 Source: Manulife Investment Management. Fund launch date: 11 September 2018.
6 Source: Manulife Investment Management, as of 30 June 2024, Dividend data refers only to Class AA (USD) MDIST(G). The dividend amount of April 2024 and May 2024 were USD 0.0050 per unit. Dividend is not guaranteed. Distribution may be paid out of capital. Refer to Important Note 2. Investors should not make any investment decision solely based on information contained in the chart above. You should read the relevant offering document (including the key facts statement) of the fund for further details including the risk factors.
7 Portfolio holdings and characteristics are subject to change at any time. Information about the asset allocation is historical and is not indicative of the future composition. The securities described are for illustrative purpose only and do not constituteany investment recommendation or advice. It should not be assumed that an investment in these securities or equities was or will be profitable.
8 Source: Manulife Investment Management, as of 1 July 2024. Distribution yield applies only to AA (USD) MDIST (G) Share class. Dividend rate is not guaranteed. Dividends may be paid out of capital. Refer to important note 2. Please note that a positive distribution yield does not imply a positive return. Past performance is not indicative of future performance. Annualised yield = [(1+distribution per unit/ex dividend NAV)^distribution frequency]–1, the annualised dividend yield is calculated based on the latest relevant dividend distribution with dividend reinvested, and may be higher or lower than the actual annual dividend yield. Diversification or asset allocation does not guarantee a profit nor protect against loss in any market.
3733733
The case for liquid real assets in a shifting inflation regime
For over a decade, global investors operated under the assumption that inflation would remain subdued, anchored below 2% - a belief reinforced by central bank credibility and structural disinflationary forces like globalisation and technological deflation. However, the post-pandemic world has ushered in a new regime of structurally higher inflation risks, with evolving policy responses that make liquid real assets increasingly attractive.
Greater China Equities: Perspective for Q4 2025
Heading into the final quarter of the year, we remain constructive, supported by the US Federal Reserve interest rate cutting cycle, Mainland’s demand-side stimulus, strategic priorities outlined in the 15th Five-Year Plan, continued recovery in corporate earnings and robust fund inflows.
Q&A: Potential market impact of a US government shutdown
The US Senate failed to pass a last-minute funding deal, triggering the first federal government shutdown in nearly seven years starting from 1 October. Our Multi-Asset Solutions Team shares insights on how markets have responded during past shutdowns, and how investors can position themselves amid the uncertainty.