28 December 2023
Joseph Bozoyan, Portfolio Manager

Concerns about the US Federal Reserve’s (Fed’s) hawkish monetary policy stance and the US regional banking crisis created notable volatility in the preferred securities market in 2023. While preferreds have partially rebounded from their lowest point of the year, their valuations are still viewed as potentially attractive, given they are trading at a significant discount to par value with yields at their highest level in 10 years. What’s more, we think the US rate hike cycle has concluded, providing positive support to preferreds as they tend to perform well when rates are stable or declining. We maintain our favourable view on the asset class, which offers unique investment opportunities for fixed-income investors looking for potentially attractive returns.
Traditional fixed-income investors experienced another volatile year in 2023, as 100 basis points of Fed rate hikes1 sent the 10-year US Treasury bond yield to 5% in October, its highest level since 20072. Thanks to a notable yield correction in November, US Treasuries managed a relatively flat return year-to-date 2023.
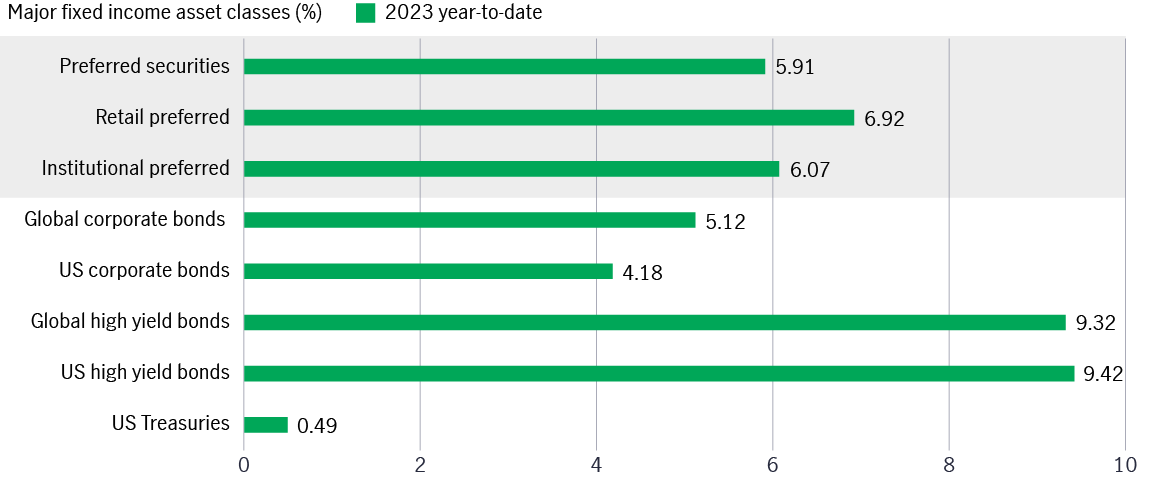
Meanwhile, other major fixed-income asset classes have delivered better returns over the same period (see chart 1)3. The broad preferred securities market rose by almost 6%, outperforming US and global corporate bonds3. Both global and US high yield bonds rose by more than 9%, benefitting from strong economic data.
Chart 1: 2023 year-to-date global fixed income performance (as of 30 November)3

Following the Fed’s rate hikes, the yield to maturity of preferred securities has risen further to 7.84%, its highest level in the past decade4. This compares to a 10-year average of 5.67%4.
Given the inverse correlation between yield and price, higher yields mean preferred securities are trading at lower prices, which presents investors with an attractive entry point. Regarding valuation, preferreds historically trade at a 2.2% premium (the long-term average) but are now available at a 13% discount to their par value (see chart 2)4. Furthermore, the retail preferred stock market is trading at an even larger discount.
The Fed has opted not to increase rates for three consecutive meetings1. We believe this rate hike cycle has concluded, and we expect the deteriorating economic conditions will push the Fed into cutting rates in the second half of 2024. This environment would be supportive of preferred securities.
2025 Outlook Series: Global Healthcare Equities
The Global Healthcare team maintains a sense of measured optimism for the performance of healthcare equities given the underlying key subsector strength in 2025.
2025 Outlook Series: Global Semiconductors
From an investment perspective, we believe a diverse, global portfolio of high conviction, quality companies in these target industries offers an attractive, long-term risk-return profile underpinned by robust fundamentals, significant tailwinds, structural demand growth and earnings visibility.
2025 Outlook Series: Asia Fixed Income
As rate paths shift and market volatility is expected to increase across global rates, credit, and currency markets, we explain why the sub-asset classes within the Asian fixed income space (Asia high yield, Asia investment grade, and Asia local currency) could provide shelter with opportunities.
Chart 2: Preferreds are trading at a deep discount to the historical average4

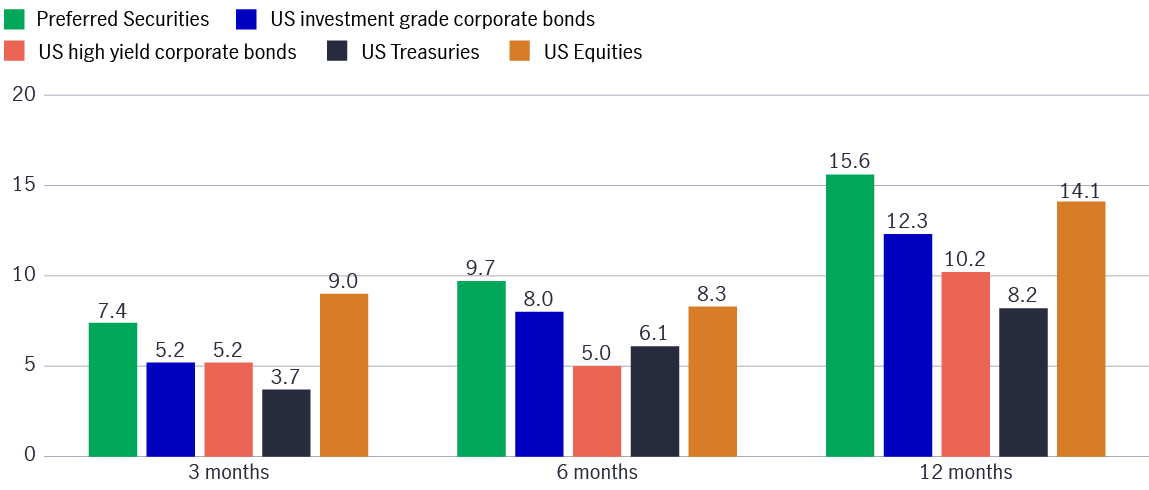
After the end of the past three rate-hike cycles, preferred securities delivered higher returns than other US fixed-income assets over 3-month, 6-month and 12-month periods. Preferreds even outperformed US equities over 6-month and 12-month periods (see chart 3).
It is well-noted that not only would rate cuts be favourable for preferred securities historically, but it was also workable when rates were stable. The past three rate-hike cycles ending in 2000, 2006 and 2018 were all followed by rate-flat periods (no change in the federal funds rate) of around 7 months,14 months, and 7 months, respectively, before rates were cut. Thus, the 3-month and 6-month returns fully reflected the rate-flat period performance, which may offer a hint to wait-and-see investors: it is not necessary to time the rate cut in order to enter the preferred securities market.
Should this rate pause continue, the market may start to believe that the rate-hike cycle is at an end and prepare for a pivot. If this is the case, investor sentiment should gradually improve, resulting in a reversion of valuations. If preferred securities can rebound from their current levels and return to par, then potential total returns (price returns plus income from yield) could be as much as over 20%.5
Apart from the Fed’s rate pathway, US inflation and growth trends are also on investors’ radars. In such an uncertain and volatile environment, we believe that adopting a defensive approach coupled with a greater choice of credit tools is the key to generating potential excess returns in 2024.
Chart 3: Average market returns after the end of past three rate hike cycles (%)6

Taking utility preferreds as an example: We maintain a positive view towards the sector, given that significant investment in US renewable energy could result in stable and visible earnings growth for regulated utilities. As such, higher-quality corporates should be able to withstand softer economic conditions.
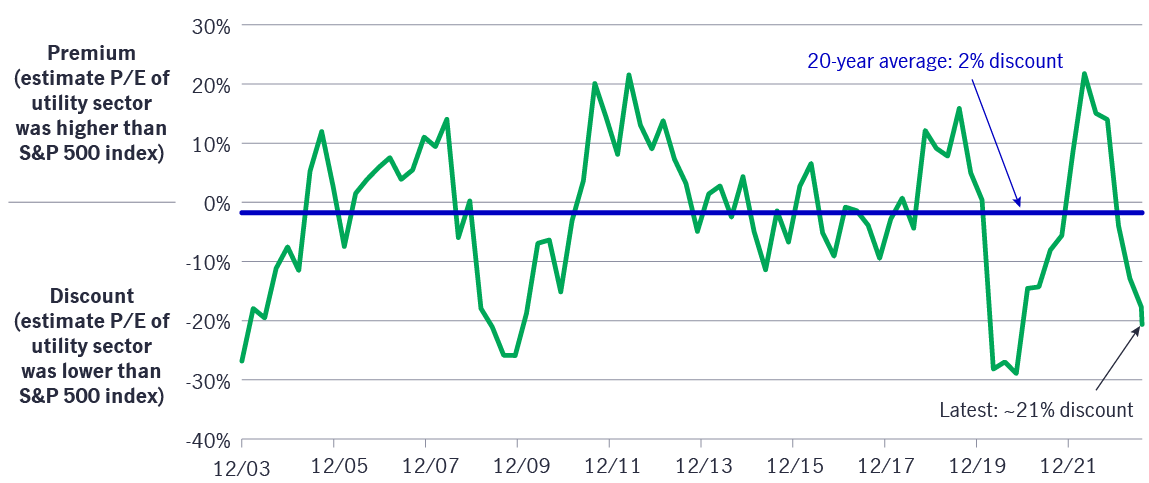
During the year, we invested mainly in fixed-income-focused utility preferreds (such as institutional preferreds and baby bonds) while keeping our equity-focused exposure (such as mandatory convertible preferreds) to a minimum given utility equities have historically underperformed during rapid increases in the federal funds rate or US Treasury yield. As expected, the equity utility sector experienced a notable correction that saw its relative valuation to the broader market head towards the low levels seen in 2003, 2009, and 2020. Given the significant valuation discount, we could increase our mandatory preferred positioning sometime in 2024.
Chart 4: 20-year equity utility valuation relative to S&P 500 index7

While we maintain a cautious view of the banking sector, we are constructive towards the larger banks, including significant financial institutional (SFI) and superregional banks, as banking fundamentals have improved due to more robust regulation (though we do not expect more US banks to collapse). SFI banks are large and have already benefited from the banking crisis in the first quarter of 2023. Large or super-regional banks have been preparing for stricter regulatory requirements following recent acquisitions. These banks have benefited from increased profitability, a tradition of strong loan underwriting, and diversified earnings.
Besides, we favour the energy sector, in particular pipeline companies. They do not have any commodity price exposure, with a simple operation model of transporting oil or gas on their pipes to collect tolls. This utility-like business is also displaying solid fundamentals since oil and gas volumes are increasing, resulting in higher cash flows for these companies.
In 2023, the preferred securities market has not illustrated a sound rebound, reflecting investors’ desire to wait and see if the Fed will announce that the rate-hike cycle has ended and a pivot has fully materialised. From a credit quality perspective, preferred securities are well positioned to weather a potential economic slowdown, as over 90% of preferred issuers are investment-grade rated. These are generally well-established, high-quality companies with solid balance sheets. From a valuation perspective, yields have reached a 10-year high and are trading at deep discounts to the historical average, which could provide further resilience. We believe that when investor sentiment gradually improves with a higher conviction in potential Fed rate cuts, preferred securities are set for a year of rebound.
1 US Federal Reserve. As of 13 December 2023, the Fed has made four rate hikes – a total of 100 basis points in 2023. The federal funds rate rose from 4.25%-4.5% to 5.25%-5.5%.
2 Bloomberg, as of 13 December 2023. The 10-year US Treasury bond yield reached as high as 5.0187% on 23 October 2023, the highest since 2007.
3 Source: Bloomberg PORT, data as of 30 November 2023. Performance is in USD and total return. Preferred securities are represented by ICE BofA US All Cap Securities index. Retail preferreds are represented by ICE BofA Core Plus Fixed Rate Preferred Securities Index. Institutional preferreds are represented by ICE BofA US Capital Securities Index. Global corporate bonds represented by ICE BofA Global Corporate Bond Index. US corporate bonds are represented by ICE BofA US Corporate Index, Global high yield bonds are represented by ICE BofA Global high yield Index. US high yield bonds are represented by ICE BofA US High Yield Index. US Treasuries are represented by ICE BofA US Treasury & Agency Index. Past performance is not indicative of future performance. It is not possible to invest directly in an index.
4 Source: Bloomberg, as of 30 November, 2023, Preferred securities are represented by the ICE BofA US All Capital Securities index, which was launched in March 2012.
5 A positive distribution yield does not imply a positive return. Past performance is not indicative of future performance.
6 Source: Bloomberg, as of 30 November 2023. Past three rate hike cycles refer to June 1999 – May 2000, June 2004 – June 2006 and December 2015 – December 2018. Monthly data are used for average return calculation. Performance In total returns. Preferred securities are represented by 50% ICE BofAML Fixed Interest Preferred Securities Index (P0P1) and 50% ICE BofAML US Capital Securities Index (C0CS) for the rate hike cycle of 1999-2000 and 2004–2006 and represented by ICE BofAML US All Capital Securities Index (I0CS) for the rate hike cycle of 2015–2018 since I0CS has shorter history starting from April 2012. US investment grade corporate bonds are represented by ICE BofA US Corporate index; US high yield corporate bonds are represented by ICE BofA US High Yield index; US Treasuries are represented by ICE BofA US Treasury & Agency index; US Equities are represented by S&P 500 Index. For illustrative purposes only. Past performance is not indicative of future performance. It is not possible to invest directly in an index.
7 Source: Bloomberg, as of 6 October 2023.The utility sector is represented by S&P 500 Utility Index. Premium/discount are calculated based on estimated price-to-earnings ratio relative to S&P 500 Index. Past performance is not indicative of future performance.
Solutions for navigating market volatility amid U.S. tariff changes
Recent changes in U.S. tariffs have introduced new dynamics to the global market landscape, presenting both challenges and opportunities for investors. Understanding these developments is essential for making informed investment decisions. Marc Franklin, our Deputy Head of Multi-Asset Solutions, Asia, and Senior Portfolio Manager provided his view.
Quick thoughts on US reciprocal tariffs
The US President Donald Trump announced reciprocal tariff details on 2 April, 2025, which has introduced volatility to the financial markets. Alex Grassino, Global Chief Economist, along with the Multi-Asset Solutions Team (MAST), Macroeconomic Strategy Team, share their latest views.
2025 Outlook Series: Global Healthcare Equities
The Global Healthcare team maintains a sense of measured optimism for the performance of healthcare equities given the underlying key subsector strength in 2025.