Back

Preferred securities offer opportunities in today's market environment

We are positive on preferred securities1 for a number of reasons:

The first reason is interest rates, which are likely to be even lower for longer. We believe it will be some time before the US Federal Reserve decides to raise rates for fear of derailing a recovery. 

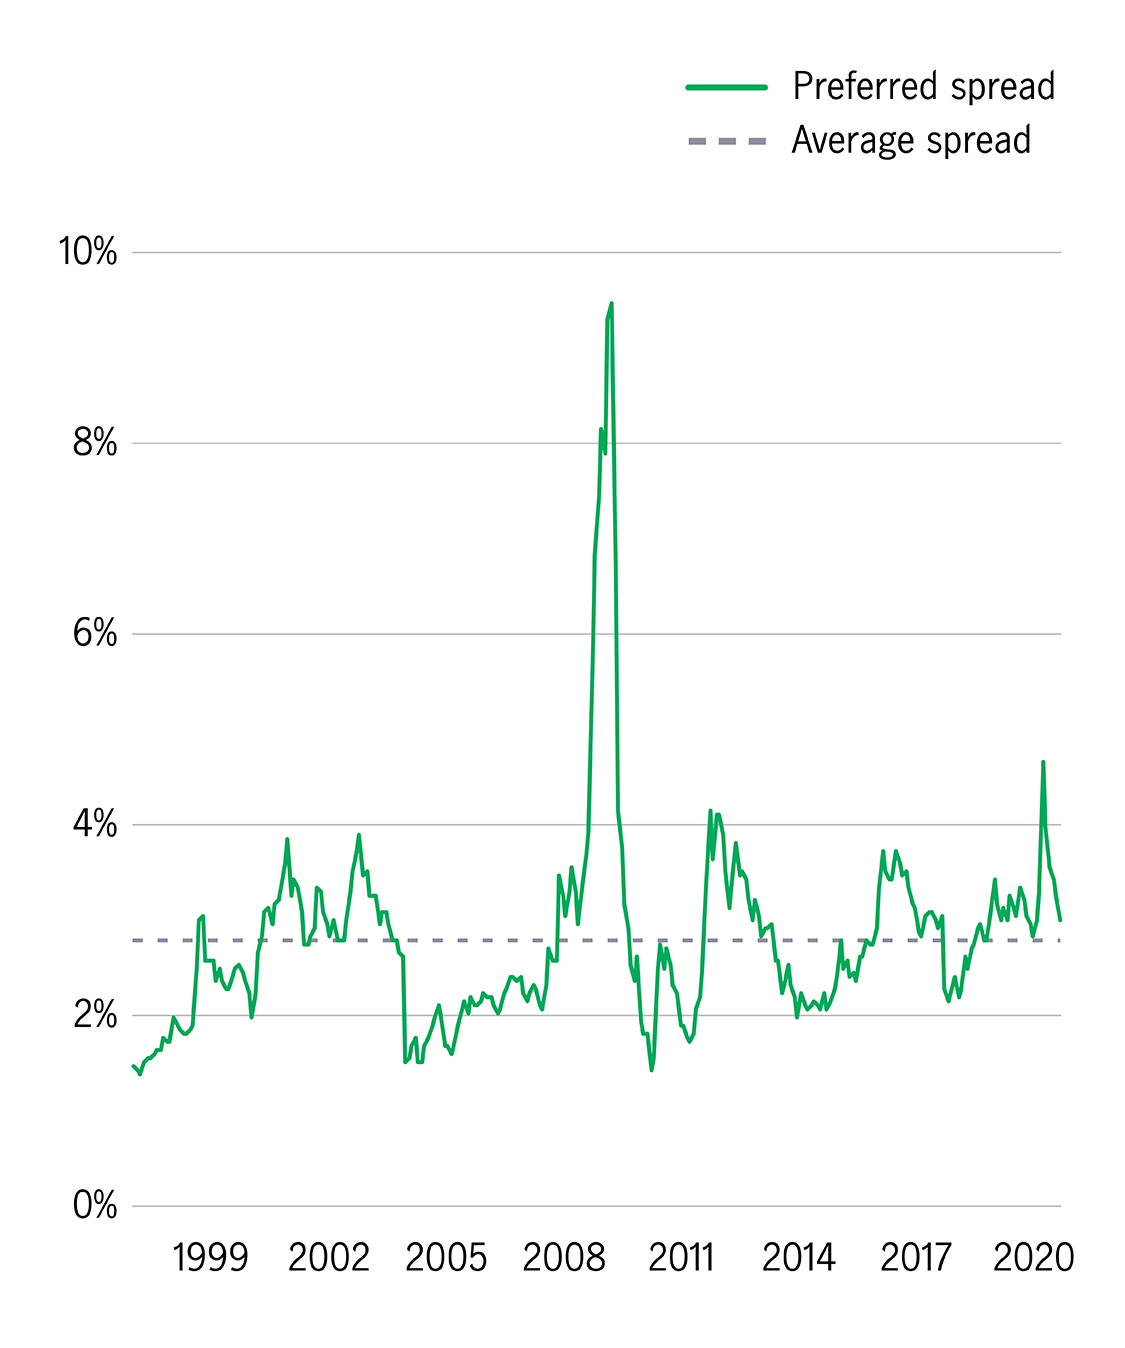
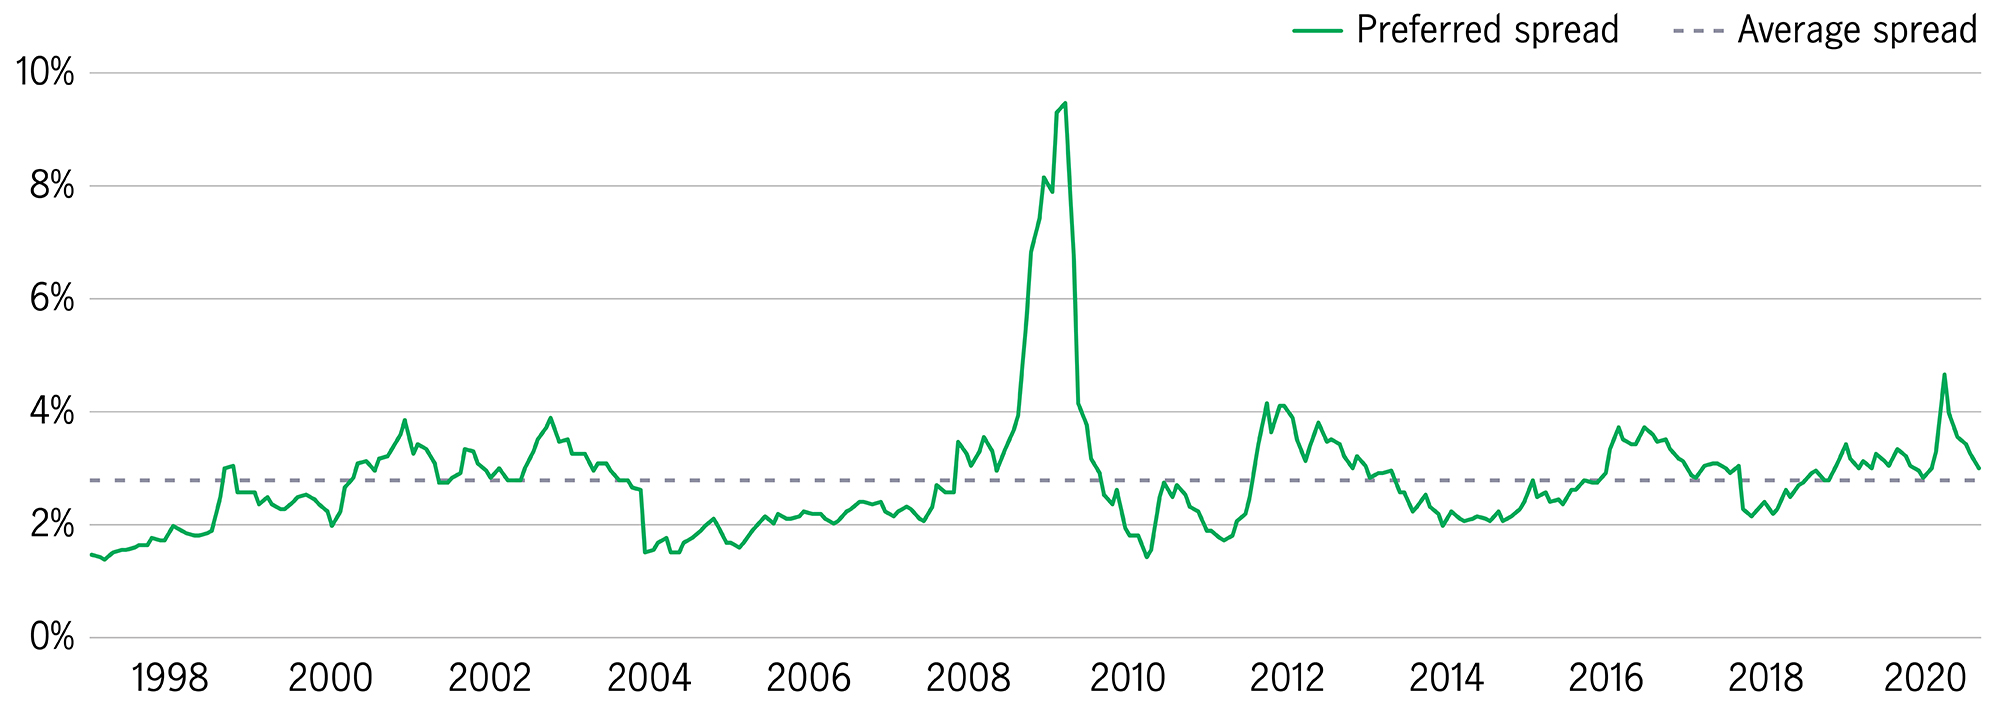
Secondly, preferred security spreads over the 10-year US Treasury bond yields remain relatively attractive and are currently at levels not seen since the global financial crisis in 2008-092.


Preferred spreads over 10-year US Treasury bond yields2
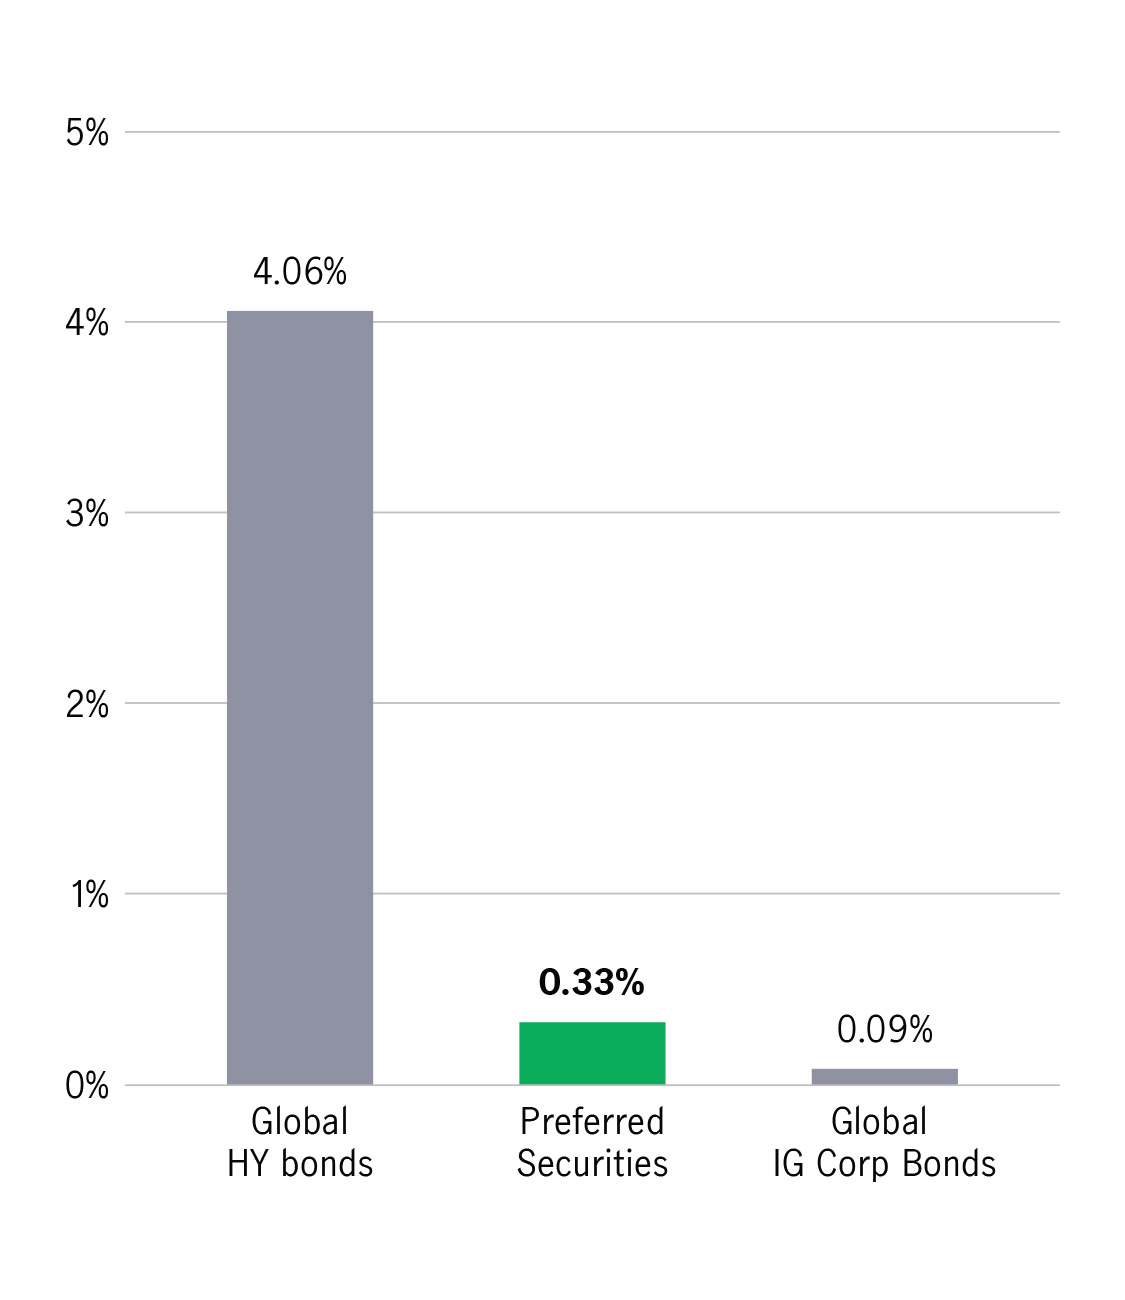
Thirdly, preferred issuers enjoy a relatively high credit quality. The average credit rating of preferreds is BBB-3. This is classed as investment grade (IG)  – indeed, most preferred issuers are investment-grade rated. In terms of corporate defaults, preferred have experienced relatively few events compared to high-yield (HY) issuers4.


Averaged long-term default rates4
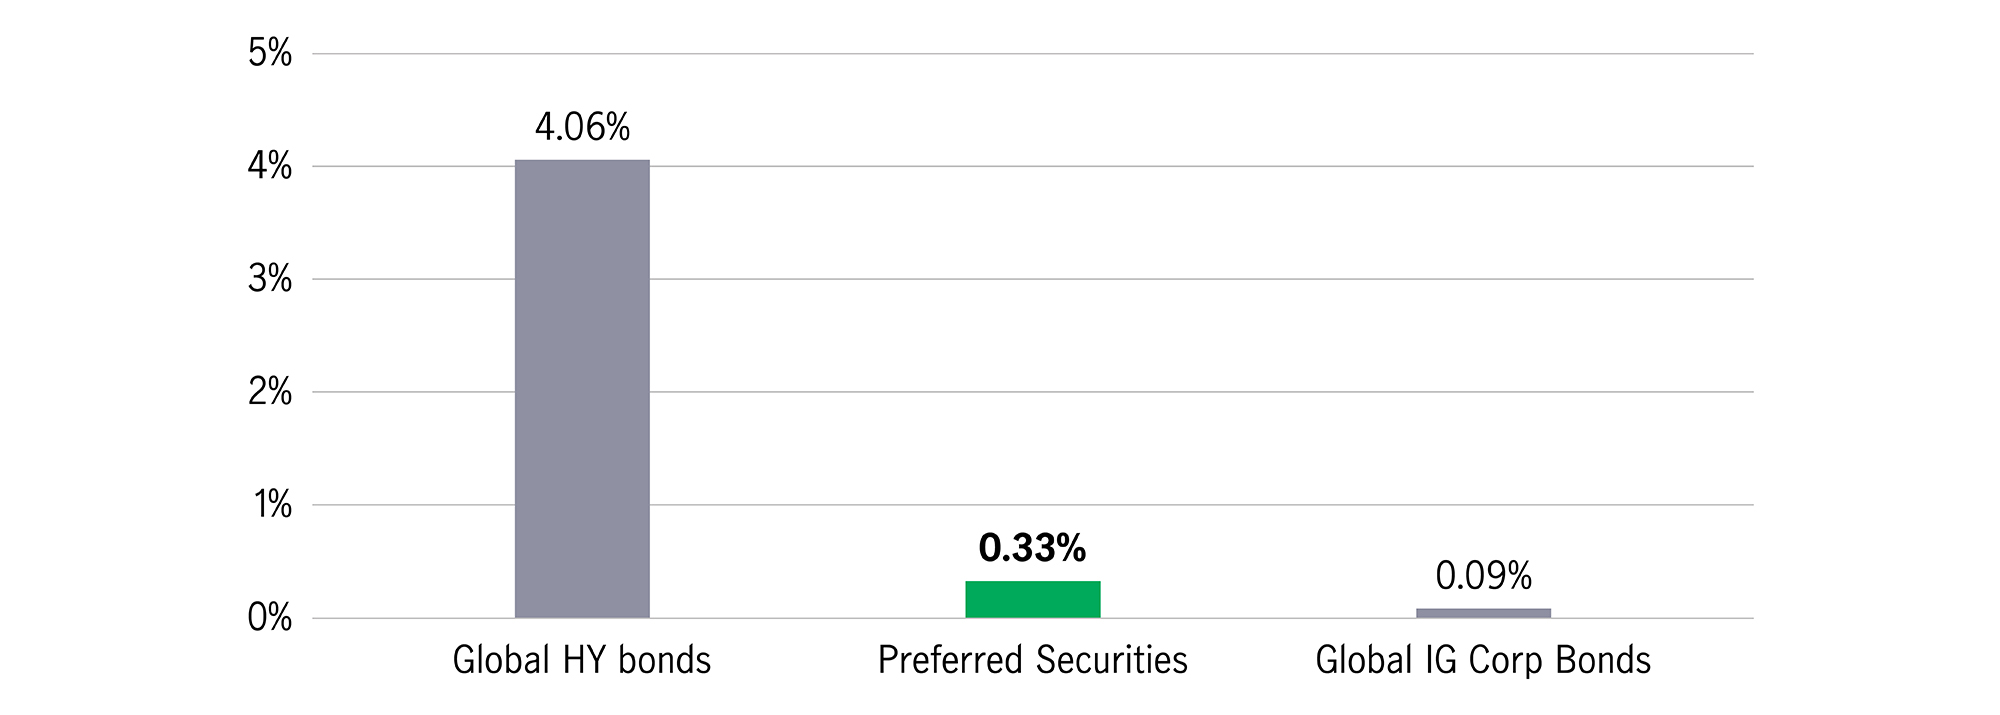
Over time, we believe that the market will recognise the value of these high-quality companies.


How much yield do preferred securities offer compared to other bonds?

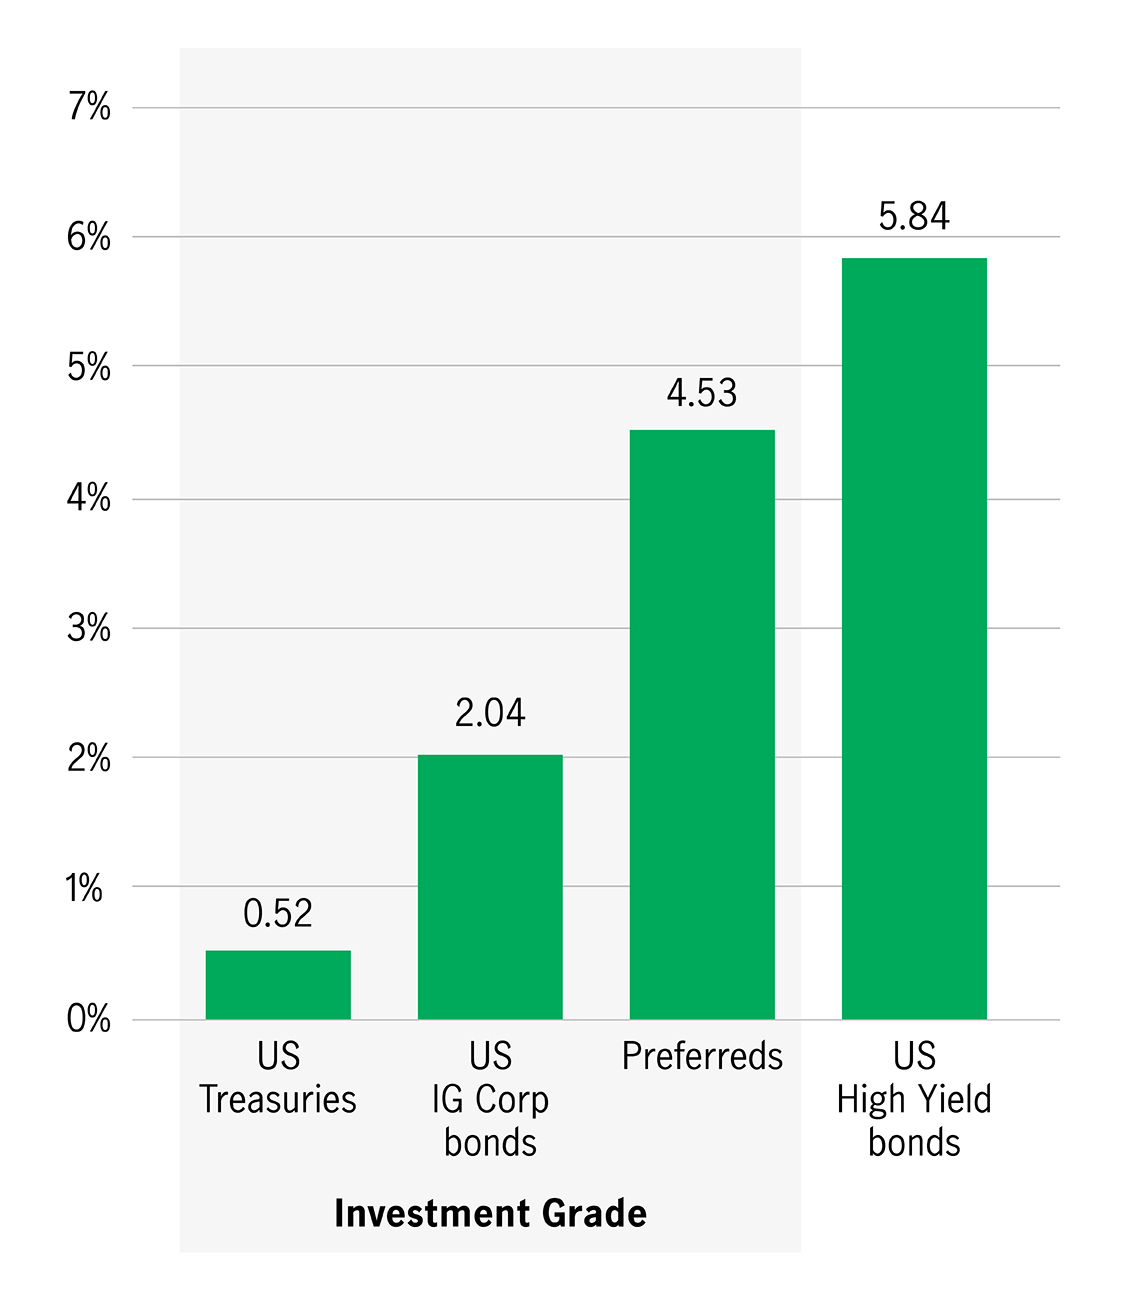
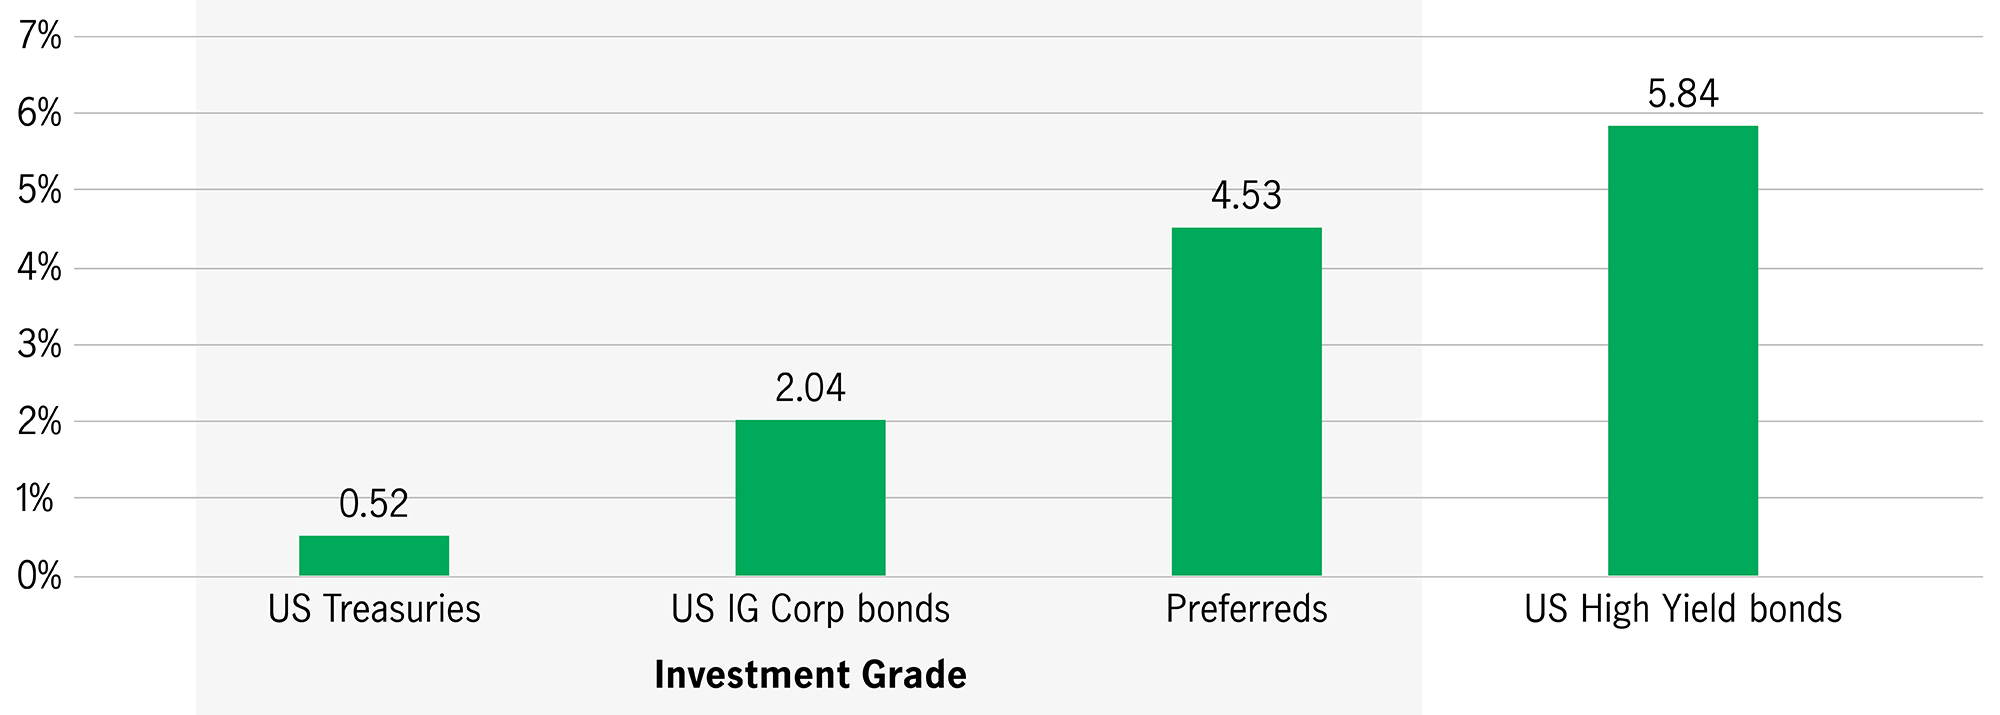
With most classed as investment grade, preferreds offer a yield to maturity of around 5%, compared to 0.53% for US Treasuries, and 2.53% for US investment-grade corporate bonds1.

The Federal Open Market Committee (FOMC)'s latest projections indicate policy rates will remain on hold through 20225. As the recovery could be a bumpy ride, investors would not only look for higher yielding asset classes for income but also focus on higher asset quality.


Yield to maturity of fixed income1
898624904

What differentiates our strategy from others?

In terms of asset allocation, we differ greatly from our peers6 and the preferred market, as we generally have a smaller allocation in financials and a higher exposure to utilities – a sector known for its defensive nature. Also, we currently have no contingent convertible bonds (CoCos) in the portfolio7.

Through our differentiated strategy, we aim to provide investors with a more defensive approach to the preferred securities market.

  1. Bloomberg. As of 31 August 2020. Preferred markets are represented by the ICE BofAML US All Capital Securities Index (I0CS). US Treasuries are represented by ICE BofAML US Treasury & Agency Index (GOAO). US IG Corporate Bonds are represented by ICE BofAML US Corporate Index (COAO). US High Yield are represented by ICE BofAML US High Yield Index (HOAO). Yield to maturity is the rate of return anticipated on a bond if it is held until the maturity date. Calculation assumes that all coupons are reinvested at the same rate. The above yield to maturity do not represent the distribution yield of any funds and are not an accurate reflection of the actual return that an investor will receive in all cases. A positive distribution yield does not imply a positive return. Past performance is not indicative of future results.
  2. Bloomberg, as of 31 August 2020. Preferred markets are represented by the ICE BofAML US Capital Securities Index since ICE BofAML US All Capital Securities Index has shorter history starting from 2012.
  3. Bloomberg, as of 31 August 2020. Preferred securities are represented by ICE BofAML US All Capital Securities Index (I0CS).
  4. As of 31 Dec 2019. Global high yield bonds and global investment grade bonds default rate are sourced from Moody's Investor Services. Preferred Securities default rate from 1990-2017 was calculated by Wells Fargo. Beginning in 2018 Manulife Investment Management used the BofAML US All Capital Securities Index to calculate the annual default since Wells Fargo stopped providing related information after 2017.
  5. FOMC, 10 June 2020.
  6. Bloomberg and market information. Preferred markets are represented by the ICE BofAML US All Capital Securities Index (I0CS). As of 30 June 2020.
  7. As of 30 June 2020. Remark: Contingent convertibles (CoCos) are debt instruments mainly issued by European banks. Coupon payments that can be omitted or cancelled at the issuer’s discretion. Part of, or the entire security converts to common equity if capital level of the bank issuer declines to levels below regulatory standards, or regulators deem a bank issuer at risk. Information about the asset allocation is historical and is not an indication of the future composition.